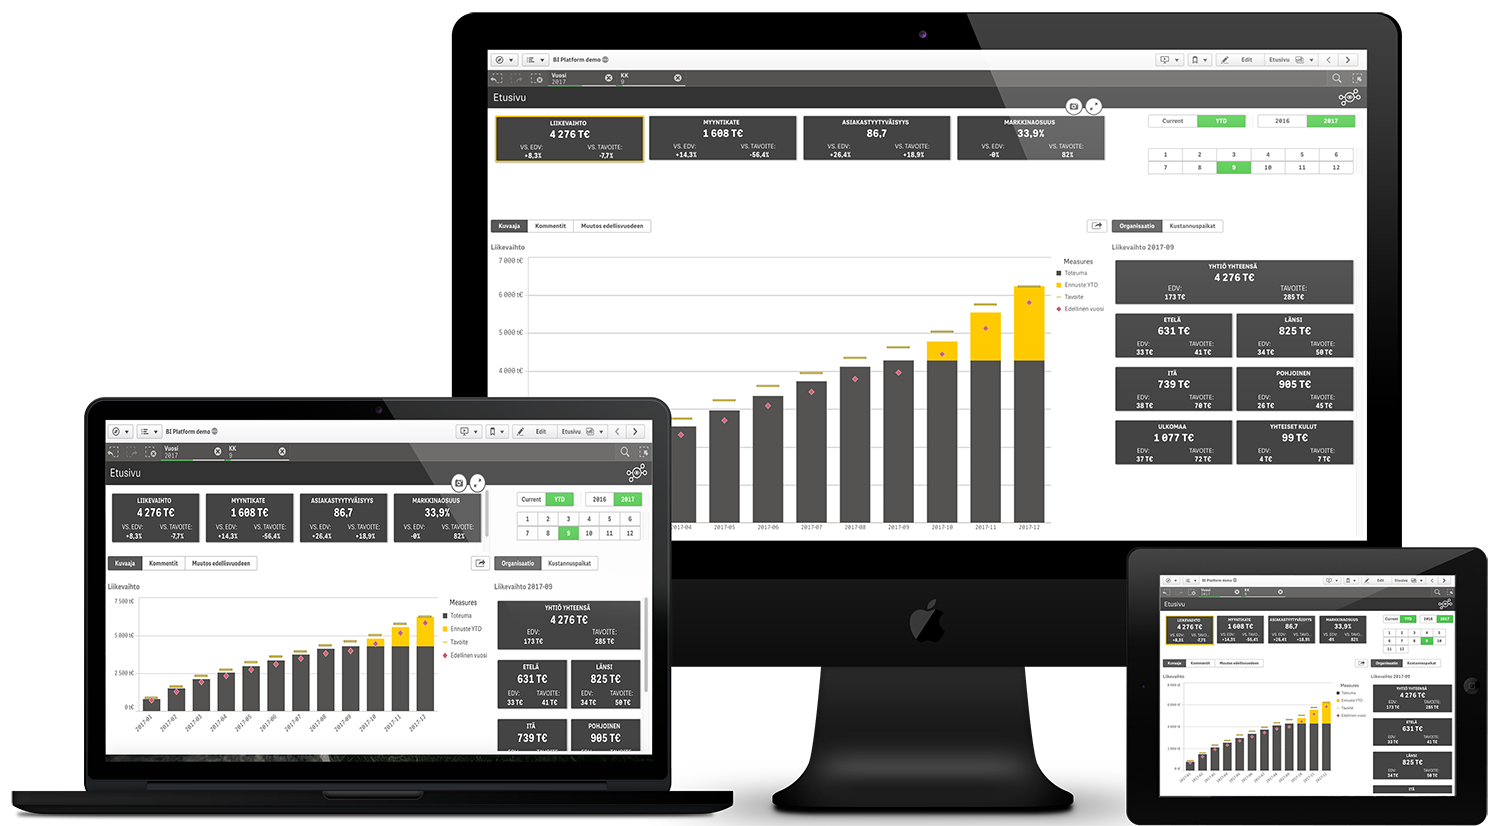
Qlik extensions as a service

eCraft GRAFFA

Supported visualizations and functional extensions as a service for Qlik Sense.

Supported and governed
Automatic updates and fixes for extensions without need for IT support. Graffa extensions are tested to work with all new versions of Qlik Sense to you don't have worry about compability issues. When new features are released extensions will be updated automatically to support the new features.

Includes all present and future extensions
We are developing new extensions and improving existing. All new extensions and updates to existing are included in subscription.

Easy to get started
Start using instantly in your Qlik environment. No complicated installations or configurations. You can even add visualizations to existing applications.

Get Started

P&L Report

Advanced Profit & Loss, Cash flow and balance sheet tables for Qlik Sense. Row based customization to allow detailed and custom views. Create nice looking formatted tables that are easy to read.

Documentation

Container

See more in a single view. Change displayed graph easily with the container extension.

Documentation

KPI

Customizable KPI with multiple custom actions and functionalities.

Documentation

CXO

Customized KPI visualization for management dashboard view. Quick glance to see KPIs for all dimension values.

Documentation

Financial reporting

P&L Table

Advanced Profit & Loss, Cash flow and balance sheet tables for Qlik Sense. Row based customization to allow detailed and custom views.
Features
  • Table Styling
  • Row Styling
  • Show/Hide Totals
  • Data Export

Get Started

Stack Visualizations

Container

See more in a single view. Change displayed graph easily with the container extension.
Features
  • Button listing
  • Drop Down listing
  • Grid listing

Get Started

Upgraded KPI Visualization

KPI

Customizable KPI with multiple custom actions and functionalities.
Features
  • Custom coloring
  • Conditional coloring
  • Custom text for second measure
  • Compare by percentage
  • Automatic formating of large numbers
  • Add actions (Set variable, Move to sheet, Select field)

Get Started

Dimensional KPI Visualization

CXO

Customized KPI visualization for management dashboard view. Quick glance to see KPIs for all dimension values.
Features
  • Custom and conditional coloring of indicator, KPI value and backgound color
  • 3 Measures displayed simultaneously
  • Dimension selection or custom selection when clicking KPI box
  • Measure labels displayed for all measures

Get Started